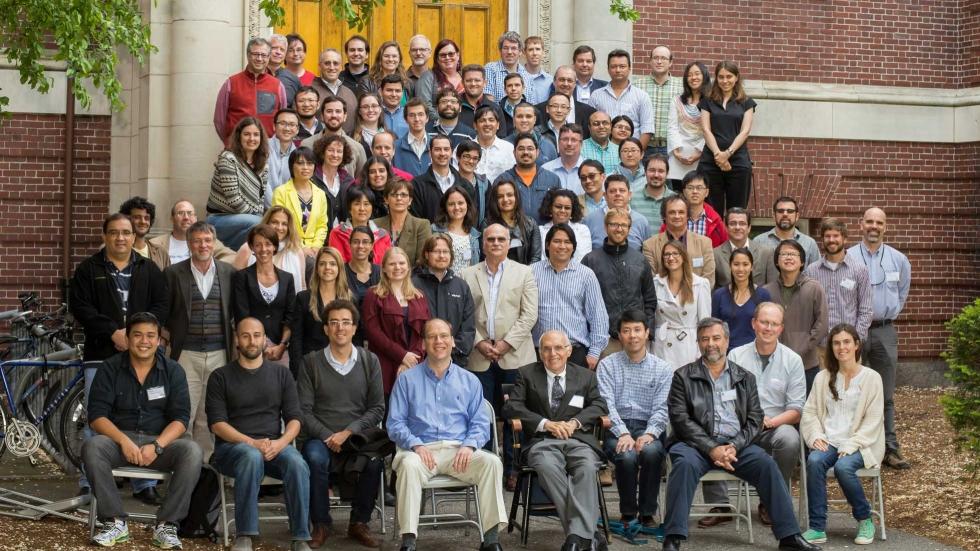
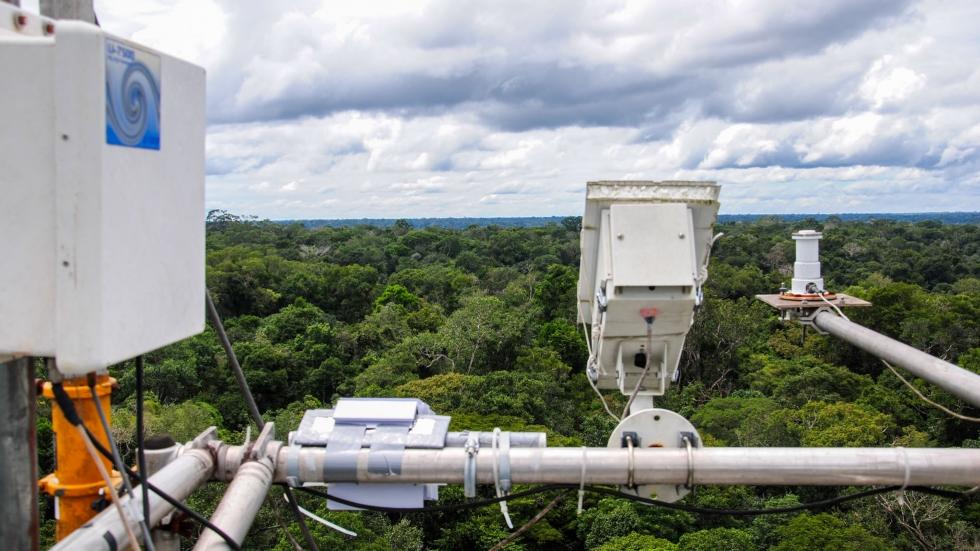
Harvard Environmental Chamber

The Environmental Chamber is employed to generate secondary-organic-aerosol particles from precursor volatile-organic-carbon molecules under both batch and continuous-flow modes. The chemistry of these particles can be adjusted by controlling reactor conditions (e.g., dark or irradiated, NOx concentrations, presence or absence of OH scavengers, among other factors).

  1. Technical Description
  2. Instrumentation
  3. Research Interests
  4. History

Technical Description

Schematic of HEC

The chamber consists of a constant temperature room (Luwa Environmental Specialties) of 2.5× 2.5 × 2.75 m3 that houses a flexible Teflon bag. A schematic diagram of the experimental setup is shown in the figure.

The flexible bag inside the room has a volume of 5 m3 (1.7 × 1.7 × 1.7 m3). The bag is made from 2 mil PFA Teflon, which is a transparent and nonreactive material. The bag is suspended within the room by a stainless steel frame, which also supports the bottom of the bag and thereby provides a clearance of 0.3 m between the floor of the enclosure and the bag. Two manifolds having multiple ports are located on opposite sides of the bag.

The temperature of the room is controlled between 20 and 40ºC by using an internal conditioning plenum that distributes the conditioned air evenly across the ceiling. Temperature is measured within the bag by three thermocouples. One RTD sensor measures the temperature outside of the bag. Ultraviolet irradiation of the bag is provided by forty-eight 40-W Sylvania 350 BL blacklights affixed to the room walls. The walls, the ceiling, and the floor are covered by reflective aluminum sheets to maximize light intensity.

Under normal operation, the chamber is operated in a feedback-controlled dynamic mode (i.e., a steady-state volume), for which the inlet flow equals the outlet flow. The steady-state induction time for our measurable quantities is approximately 4 hours. Following this approach, our experiments can run for several days using a constant aerosol source. The typical throughput flow is 20 L min-1, providing a calculated residence time of 3.9 h. The contents of the chamber are well mixed.

The injection system for precursor gases, which consists of solenoid valves and mass flow controllers, regulates flow rates within 1% accuracy and precision. Propene, NO, and NO2 are drawn from cylinders containing 300 ppmv dilutions of each gas in N2 (Spectra Gas). Clean air is generated by removing hydrocarbons, H2O, and NOx from compressed air (Aadco Model 737-14A pure air generator). Ozone is synthesized by passing pure air over a UV lamp (Jelight 600). Relative humidity is regulated by passing a variable flow of clean air through a bubbler containing 18 Mω cm water. Ozone, RH, NOx are computer-controlled to be at constant levels through a Labview interface. The volatile-organic-carbon molecules, which are obtained commercially (Aldrich), are introduced by injecting a known volume from a heated bulb flushed with clean air. As desired, seed particles can also be injected by an atomizer.

Return to top of page

Instrumentation

The instruments outfitted to the chamber are listed in the table shown to the side.

Return to top of page

CCN Activity of Secondary-Organic-Aerosol Particles


The cloud condensation nucleus (CCN) activity of organic-sulfate particles was investigated using the HEC. The organic component consisted of secondary organic aerosol (SOA) generated in the dark from 24 ± 2 ppb α-pinene for conditions of 300 ± 5 ppb ozone, 40 ± 2% relative humidity, and 25 ± 1°C, with the organic mass loading in the chamber ranging from 23 to 37 μg m-3. CCN analysis was performed for 80- to 150-nm particles having variable organic-sulfate volume fractions, which were estimated from the diameter of the organic-sulfate particle relative to that of the seed as well as independently from mass spectra. Critical supersaturation, which increased for greater SOA volume fraction and smaller particle diameter, was well predicted by a Köhler model having two components, one for ammonium sulfate and another for SOA. The entire data set could be successfully modeled by a single suite of effective chemical parameters for SOA. The results suggest that the effects of limited organic solubility in mixed SOA-sulfate particles may be reliably omitted in the treatment of cloud droplet formation.

Top figure: Representative CCN activation curves of SOA particles having ammonium sulfate cores of 51-nm diameter. Critical supersaturation, Sc, is determined as the supersaturation intersecting the dotted line, where Fa = 0.5.

Bottom figure: Sc of SOA particles internally mixed with sulfate. Data are shown for four particle mobility diameters for increasing organic volume fraction (εdSOA). Curves represent modeled values using a single set of parameters. Insets: (a) Comparison of modeled Sc to observed Sc for all particle diameters. Comparison to the shown 1:1 line yields an r-squared value of 0.99. (b) Modeled Sc values of 100-nm mixed SOA-sulfate particles for a limited-solubility system with varying values of Csat,SOA.

Ref: S.M. King, T. Rosenoern, J.E. Shilling, Q. Chen, and S.T. Martin, "Cloud condensation nucleus activity of secondary organic aerosol particles mixed with sulfate," Geophysical Research Letters, 2007, 34, L24806. PDF File. Supporting Information.

Return to top of page

Yield of Secondary-Organic-Aerosol Particle Mass

Multiple studies indicate that state-of-the-art chemistry and transport models, which rely on laboratory parameterizations of SOA yield, under-predict the measured SOA mass by a factor of 10-100. In an effort to reconcile these differences and to provide yield data for atmospherically relevant amounts of reacted hydrocarbon, the yield of secondary organic aerosol (SOA) mass was measured for the dark ozonolysis of 0.3 - 22.8 ppbv of reacted α-pinene. For mass loadings of 2.0 to 40 μg m-3, the SOA mass yields are 1.8 to 2 times larger than batch-mode results reported in literature. For the lowest loadings studied (0.15 - 2 μg m-3), we observe a steep, step-like increase in the SOA mass yields with loading and yields appear to be nearly stoichiometric (ie., nearly independent of loading) over this range. Furthermore, we observe significant SOA formation for reacted α-pinene concentrations as low as 0.3 ppbv while literature data suggest that no SOA formation will occur for reacted α-pinene concentrations below 1 ppbv. As a result, for loadings below 2 μg m-3, our yields are offset from the literature data by approximately +0.07. Our new observations of higher yields at low mass loadings are potentially important for reconciling the differences between the predictions of chemical transport models and recent ambient observations.

This figure shows the comparison of particle SOA mass yield obtained in this work to those of other studies for the dark ozonlysis of α-pinene. Data shown in Panels A1 and A2 are as reported by the original researchers, with the exception of the data of Gao et al.(2004), which are adjusted by us to ρ1.0, to facilitate the comparison with other studies all reported for this density. The studies were conducted at different temperatures, which affects SOA particulate yield. Therefore, yield data shown in panels B1 and B2 are adjusted, by us to 298 K, using a temperature correction of 1.6% per K, as recommended by Pathak et al. (2007a).

Ref: J. E. Shilling, Q. Chen, S. M. King, T. Rosenoern, J. H. Kroll, D. R. Worsnop, K. A. McKinney, and S. T. Martin, "Particle Mass Yield in Secondary Organic Aerosol Formed by the Dark Ozonolysis of alpha-Pinene," Atmospheric Chemistry and Physics, 2008, 8, 2073-2088. PDF file. Supplement.

Return to top of page

History

The Harvard Environmental Chamber began operation on April 27, 2006. The team included Qi Chen, Stephanie King, Prof. Scot Martin, Dwane Paulsen, Thomas Rosenoern, and John Shilling. The figures show below some of the results of our first work with alpha-pinene.


Example of the generation of SOA particles after injection of α-pinene (19 May 2006). In these first runs, repeated nucleation events are apparent. For this reason, we next introduced sulfate seed particles.

Evolution of particle size distribution of SOA particles. Top: data from the dark ozonolysis of α-pinene with injection of seed particles. Instead of nucleation events, a steady-state distribution is obtained. Bottom: predicted evolution by an iterative model, applying parameters determined by traditional empirical model of two-condensable products.
Return to top of page