News
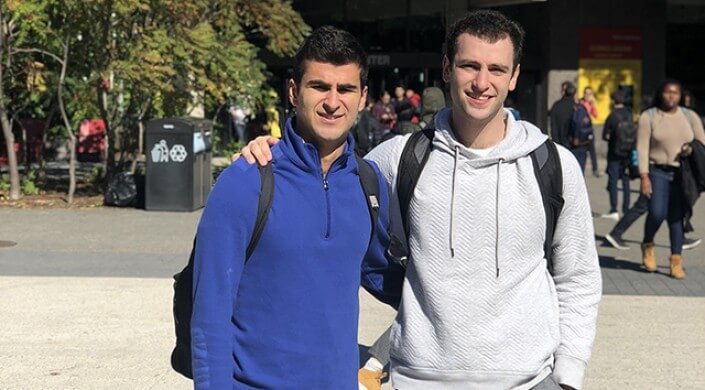
Applied math concentrator Dario Zarrabian, A.B. ’19 (left) and statistics concentrator Nate Hollenberg, A.B. ’20, are using data science to help Team USA Basketball develop a winning strategy. (Photo courtesy of Dario Zarrabian)
To most observers, a blistering, bruising basketball game is a contest of speed and athleticism. But to Dario Zarrabian and Nate Hollenberg, the sport is very much a numbers game.
The two undergraduates at the Harvard John A. Paulson School of Engineering and Applied Sciences have teamed up with USA Basketball on a series of projects to incorporate data science techniques into Team USA’s strategies.

Dario Zarrabian, A.B. ’19, an applied math concentrator, prepares for a defensive match-up during a high school basketball game. (Photo courtesy of Dario Zarrabian)
After hearing about the project through the Harvard Sports Analysis Collective, the two basketball buffs jumped at the chance to combine their passions and academic interests. They provided recommendations to Kirk Goldsberry, analyst for Team USA Basketball and Vice President of Strategic Research for the San Antonio Spurs (and a former visiting scholar in the Harvard Center for Geographic Analysis), on creating a structured database that tracks performance statistics of players among many different leagues.
From there, they dove deeper and used statistics to help the team develop a strategy for the Nike Hoops Summit, a high-profile game that pits the best U.S. high school players against top international opponents. Using advanced math, they analyzed box score data from past Nike Hoops games.
“When Team USA lost, they were up against really talented players who dominated these games. But the data also showed us that Team USA treated the game more like an all-star game—they didn’t play defense,” said Hollenberg, A.B. ’20, a statistics concentrator with a secondary in computer science. “If we can ingrain in these players the importance of playing defense, the data suggest they can gain the upper hand.”
Hollenberg and Zarrabian are now putting their statistical chops to the test on an even bigger stage—they are working on an analytical scout for the upcoming International Basketball Federation (FIBA) World Cup. The project is so immersive they’ve taken it on as an independent study with Kevin Rader, Senior Preceptor in the Department of Statistics. Over the next few months, they will analyze each of the 32 teams in the tournament so Team USA has the best chance possible to beat each potential opponent.
“In this type of tournament-style play, Team USA won’t have a lot of time to prepare for games, so it is useful to know who the best players are on each team, especially since the rosters might change at the last-minute, so they can key their game plan on those top players,” Hollenberg said.
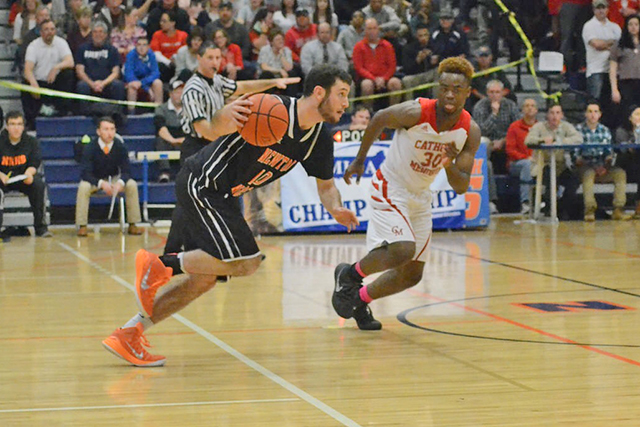
Nate Hollenberg, A.B. ’20, a statistics concentrator with a secondary in computer science, drives the ball down the court during a high school basketball game. (Photo courtesy of Nate Hollenberg)
He and Zarrabian will analyze every game the world teams played during the qualifying rounds. But beyond just taking averages and tallying points and rebounds, they will build complex models that control for pace of play and weight inputs based on the strength of each opponent. By examining shot charts—which use geographic software to overlay data onto a basketball court instead of a map—they can see where a team’s hot and cold zones are.
“You can learn a lot just by looking at a box score,” said Zarrabian, A.B. ’19, an applied math concentrator. “You can look at it from an average sampling over time, but what we are doing is more complex because we are looking at the individual-game level. If a player makes a certain number of threes during a game, you can see when he starts getting efficient and becomes unstoppable. Looking at key individual instances, rather than the overall averages, helps us make the best recommendations possible.”
The biggest challenge he foresees as they gear up for this project is the sheer volume of data to analyze.
“It will also be challenging to make sure we are prioritizing properly and are able to make the best recommendations for every team, while not overlooking a single team,” he said. “All it takes is one game, and one surprise team to show up. If Team USA is not well prepared for that, it is hard to dig yourself out of a hole.”
Determining how to effectively weight different teams will also be tough, since there are so many factors to consider. For instance, each region has a very distinct style of basketball, Zarrabian explained.
Teams from Africa tend to focus on speed and have a more athletic style of play, but a higher percentage of their shots are blocked. By contrast, teams from Europe play at a slower pace, but tend to have solid three-point shooting. Building a model that can take into account those regional differences will require careful analysis, he said.
For Hollenberg, the biggest surprise of this project has been how little Team USA had used statistics in the past. Spur-of-the-moment decision making is still common, despite the vast amount of basketball data available, he said.
“I’ve learned a lot about communicating data,” Zarrabian said. “It is really easy for us to analyze this and see what it means, but we have to make sure that we communicate in a way that is most efficient for the coaches and players who will be actually making these decisions.”
Topics: Applied Mathematics
Cutting-edge science delivered direct to your inbox.
Join the Harvard SEAS mailing list.
Press Contact
Adam Zewe | 617-496-5878 | azewe@seas.harvard.edu