News

Computational science and engineering master's students (from left) Nathaniel Burbank, Xinyuan Wang, and Mali Akmanalp used data analytics to help the Massachusetts Bay Transportation Authority generate a more granular model of passenger transactions. (Photo by Adam Zewe/SEAS Communications.)
Getting around Boston can be tricky. For many people, hopping onto one of the Massachusetts Bay Transportation Authority (MBTA) buses that crisscross the metro area is often the easiest way to get from point A to point B. For the MBTA, effectively forecasting revenue is not quite so simple.
A team of students in the computational science and engineering master’s program offered by the Institute for Applied Computational Science (IACS) at the Harvard John A. Paulson School of Engineering and Applied Sciences used data analytics to help the MBTA generate a more granular model of passenger transactions.
“Because of the complexity of the fare system and the large number of monthly pass holders, precisely assigning revenue to, say, a specific hour on a specific bus route is much more complicated than just counting passengers,” said Nathaniel Burbank, S.M. ’17. “To conduct that kind of analysis, you have to drill down much further.”
He and teammates Mali Akmanalp, S.M. ’17, and Xinyuan Wang, S.M. ’17, dove into a dataset that included every swipe onto an MBTA bus or subway by holders of monthly passes (commonly referred to as Charlie Cards) in 2016. About 65 percent of MBTA users hold monthly passes, which allow unlimited trips on any of the local bus routes, so attributing pass revenue to each different route presents a complex challenge, Burbank explained.
Sifting through 275 million transaction records was the first challenge the students faced. From there, they grouped transactions that were likely transfers together and then annotated the raw data and assigned revenue on a per-transaction basis.
“If you get on the bus and take it to the subway, that counts as two transactions,” Burbank explained. “We wanted to link those two together so we could do analytics on the transfer path.”
They built a computational model incorporating data from passenger swipes and bus line trip schedules. They used that model to create a user-friendly website that graphically compares costs and revenue for each bus line and organizes the data by time-of-day and day-of-week.
Among the most interesting findings the students uncovered is that average monthly pass holders spend slightly more per trip than riders who purchase more expensive single-ride tickets. Average revenue per bus trip is $1.28, slightly more than the $0.90 average the MBTA uses for planning purposes.
In addition, northern bus routes tend to earn more revenue than routes in the city’s southern areas and express service is consistently a high revenue generator. The busiest and highest-earning single bus route is the 66, which runs from the Harvard Square bus/subway station into neighboring Allston, a hotbed of affordable student housing.
By providing a comprehensive, organized dataset and a user-friendly web tool, the students hope MBTA officials will be able to more effectively plan routes or estimate the costs and revenues of accommodating increased traffic for special events.
While the project revealed some routes as revenue “underperformers,” the students cautioned that the aim of the project was not to rank routes by revenue or profitability.
“On the axis of how valuable a bus route is, this is but one of many considerations. If we cancel a bus route that is losing money, other lines might lose passengers as well because people can’t transfer from one subway line to another as easily,” Akmanalp said.
One of the goals of the project was to develop a deeper understanding of the complex interplay between a bus route’s location, schedule, and passenger profiles on the amount of revenue it generated. With a more accurate model of how different operational decisions contributed to revenue generation in the past, the students hope future transportation planners will be able to more accurately forecast resource impacts as they adjust bus schedules and routes in line with their larger public service mission.
“We always tried to keep the social benefits of the system in mind,” Akmanalp added. “A given bus line may be the life blood of the economy for a neighborhood it serves.”
Burbank said that sentiment reinforces one of the most significant lessons he and his peers took away from this project—even a topic as seemingly simple as a city bus route often holds many layers of complexity under the hood.
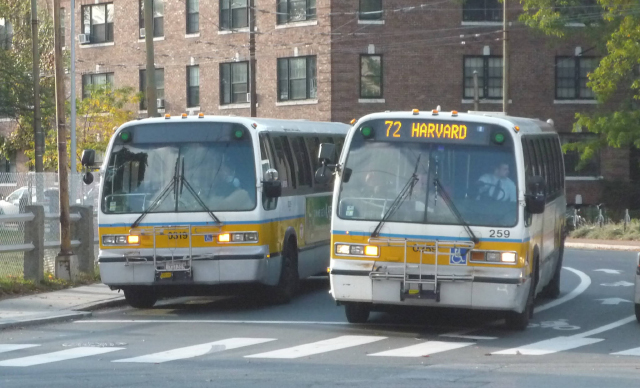
With a more accurate model of how different operational decisions contributed to revenue generation in the past, the students hope future transportation planners will be able to more accurately forecast resource impacts as they adjust bus schedules and routes in line with their larger public service mission. (Photo courtesy of Jason Lawrence/Wikimedia Commons.)
Topics: Computer Science
Cutting-edge science delivered direct to your inbox.
Join the Harvard SEAS mailing list.
Press Contact
Adam Zewe | 617-496-5878 | azewe@seas.harvard.edu


