News
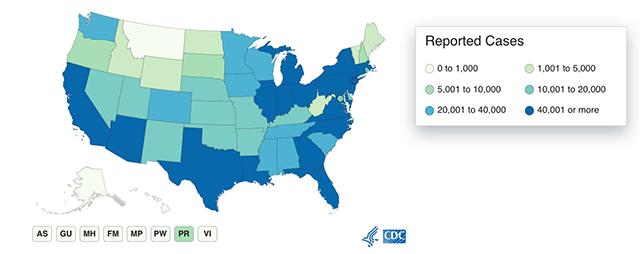
This map from the CDC shows COVID-19 cases reported by U.S. states, as of June 22, 2020.
Mounting case counts, flattening death rates, an “r-naught” hovering just above or below one—numbers have been front and center since the COVID-19 pandemic gripped the world earlier this year.
In a teachable moment pulled straight from the headlines, some students in Advanced Topics in Data Science (CS 109B) applied computational tools to that ever-changing COVID-19 data to help track, predict, and better understand the spread of the disease.
For their final projects , students in the course, taught by Pavlos Protopapas, Scientific Director of the Institute for Applied Computational Science at the Harvard John A. Paulson School of Engineering and Applied Sciences, are broken into groups that work with experts. Many student teams chose to focus the machine learning models they built on elements of the COVID-19 pandemic.
One team, consisting of Johannes Kolberg, S.M. '21, Hardik Gupta, S.M. '21, and Will Seaton, S.M. '21, used recurrent neural networks to predict COVID-19 case growth at the national level. They built a model that used a rolling, 14-day window of coronavirus case growth, infection testing counts, and national mobility levels to forecast the rate of daily new cases a week into the future.
The team also explored whether the rate of daily new cases could be forecast using infection testing counts and national mobility levels exclusively, and whether data from countries that were impacted by COVID-19 earlier, like South Korea, could be used to better predict what would happen in countries like Canada, which was impacted later.
"One challenge we faced is that you can trust the case counts in different countries to varying degrees. This is why we realized we needed to include multiple time series like testing rates and mobility to improve accuracy," Seaton said. "In our results, we found outlier nations where our predictions did not appear to fit the trends of most other countries. On doing some more research, we found that nearly all these countries had much looser or no lockdowns and have since had higher than average coronavirus case counts. Using multiple time series helped us to deal with real-world policy factors like accurate case reporting."
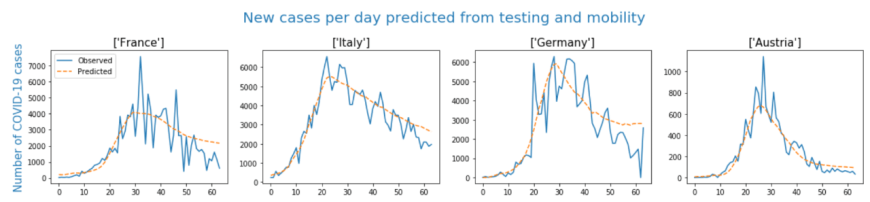
This graph shows the analysis Seaton, Kolberg, and Gupta performed using exclusively testing counts and mobility data from Apple and Google to predict that nation's new cases per day.
Lack of accurate data was a challenge encountered by many groups.
For instance, when Martin Jin and Yichu Jin, both materials science and mechanical engineering Ph.D. candidates; and Tianning Zhao, an environmental science and engineering Ph.D. candidate, used mobility data to predict how COVID-19 case counts would change in the U.S., they came up with strange results. Their model seemed to show that higher levels of mobility were related to lower COVID-19 case counts.
A deeper dive into the data revealed the underlying issue: the U.S. experienced high levels of mobility in January and February, but low case counts, while the higher case counts in March and April corresponded with lower mobility due to state lockdowns.
They analyzed three different machine learning models and incorporated earlier time series data from China to overcome the lack of U.S. data. The team found that neural networks based only on U.S. case counts and mobility data was the best model to predict case growth.
“One of the limitations with our projects, and I think this holds for many machine learning projects, is that you really need to be very careful with the data you are using. The data we are using right now are just representative of how many cases we have every single day, but that is not really what the actual number is. I don’t think anyone knows what the actual number is,” Yichu Jin said. “Using machine learning, we see a lot of artifacts because we have this delay in reporting what the confirmed cases are, so we have this false trend.”
Pooja Tyagi, Tudor Cristea-Platon, and Chris Nadine Kranzinger built a model to track the spread of the pandemic based on when a state initiated a lockdown.
Faced with inconsistencies in case data reported by U.S. states, a group comprised of T.H. Chan School of Public Health biostatistics students Pooja Tyagi, S.M. ’20 and Tudor Cristea-Platon, S.M. ’20, and Harvard Kennedy School master of public administration candidate Chris Nadine Kranzinger, chose to focus on a more reliable statistic: the number of deaths from COVID-19.
They built a model to track the spread of the pandemic based on when a state initiated a lockdown. The concept of imposing a lockdown to flatten the curve and reduce the number of peak deaths is well understood, but the team found an additional insight: the timing of the lockdown is crucial.
Their work showed that Implementing a lockdown earlier decreases the number of total deaths from the disease, not just peak deaths.
“The concept of ‘flattening the curve’ has led to so much hopelessness because it is believed that the number of deaths is going to be the same, they are just going to be more spread out. But our research shows that the number of deaths does change, and that was a big surprise,” Tyagi said. “This can definitely help in determining the timing of a lockdown. It is not unreasonable to think that there may be a future pandemic. If we implement even an imperfect lockdown earlier, fewer people will people die.”
Another group, comprised of Chan School health data science students Genevieve Lyons, S.M. ’21, Rebecca Youngerman, S.M. ’21, and Amita Varma, S.M. ’21, took a different approach—they sought to determine if machine learning could help in the diagnosis of COVID-19.
While an antibody test is the gold standard in diagnosis, production line problems have led to accessibility issues, so some countries have used lung CT scans to help diagnose the disease, Lyons explained. She and her teammates built a neural network model that could detect COVID-19 in a lung CT scan. The students worked with a physician and a radiologist to interpret the lung CT scans they used to train the model.
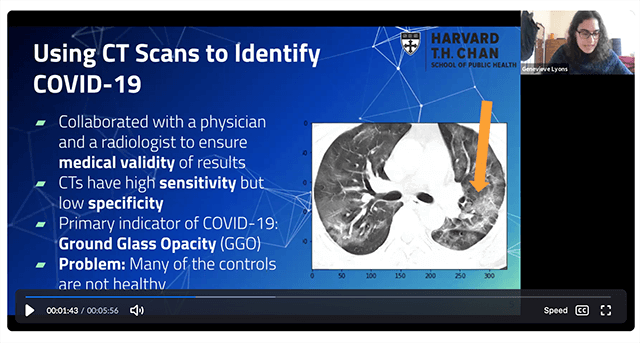
Genevieve Lyons, Rebecca Youngerman, and Amita Varma sought to determine if machine learning could help in the diagnosis of COVID-19.
Convolutional neural networks are commonly used for image recognition, so the team trained their model to detect ground glass opacity—an asymmetric haziness in the lungs—that is one symptom of COVID-19. Their model was able to detect COVID-19 with 85 percent accuracy, and they were careful to refine the model as much as possible in an effort to minimize the number of false negatives and false positives it registered.
Training the network with such a limited amount of data—only 800 lung scans—was a major hurdle, but the team was able to train their model using a technique called transfer learning, which exploits a pre-existing model and then adapts its learning to their task. And even though their model was successfully able to diagnose COVID-19 in many cases, the students caution that it isn’t something that should be used on its own.
“We don’t want a machine learning model making a diagnosis—that needs to be done by a doctor,” said Youngerman. “But what we have shown is that, while having two radiologists read an image is the gold standard, our model could augment their process or facilitate the prioritization of high-risk cases.”
For Lyons and her colleagues, being able to see the concepts they’ve learned in class play a role in tackling a timely problem was especially exciting.
Ultimately, Protopapas and teaching assistant Ethan Cowan hope the students left the course with a better appreciation for what it takes to answer thorny data science questions in the real world, where the data are messy and the stakes are high.
“As someone who has worked in industry, I wanted students to be prepared for the ambiguity of the real world. Oftentimes, you are given a dataset, and you’re not even sure what question you should ask yet. You need to understand what questions can be answered, and what questions can be answered well,” Cowan said. “This gives them a broader perspective on what the research world looks like.”
Topics: Computer Science, COVID-19
Cutting-edge science delivered direct to your inbox.
Join the Harvard SEAS mailing list.
Press Contact
Adam Zewe | 617-496-5878 | azewe@seas.harvard.edu


